The historical truckload cycle offers valuable insights into today’s truckload market and helps us anticipate future trends as we analyze the balance between freight demand and supply.
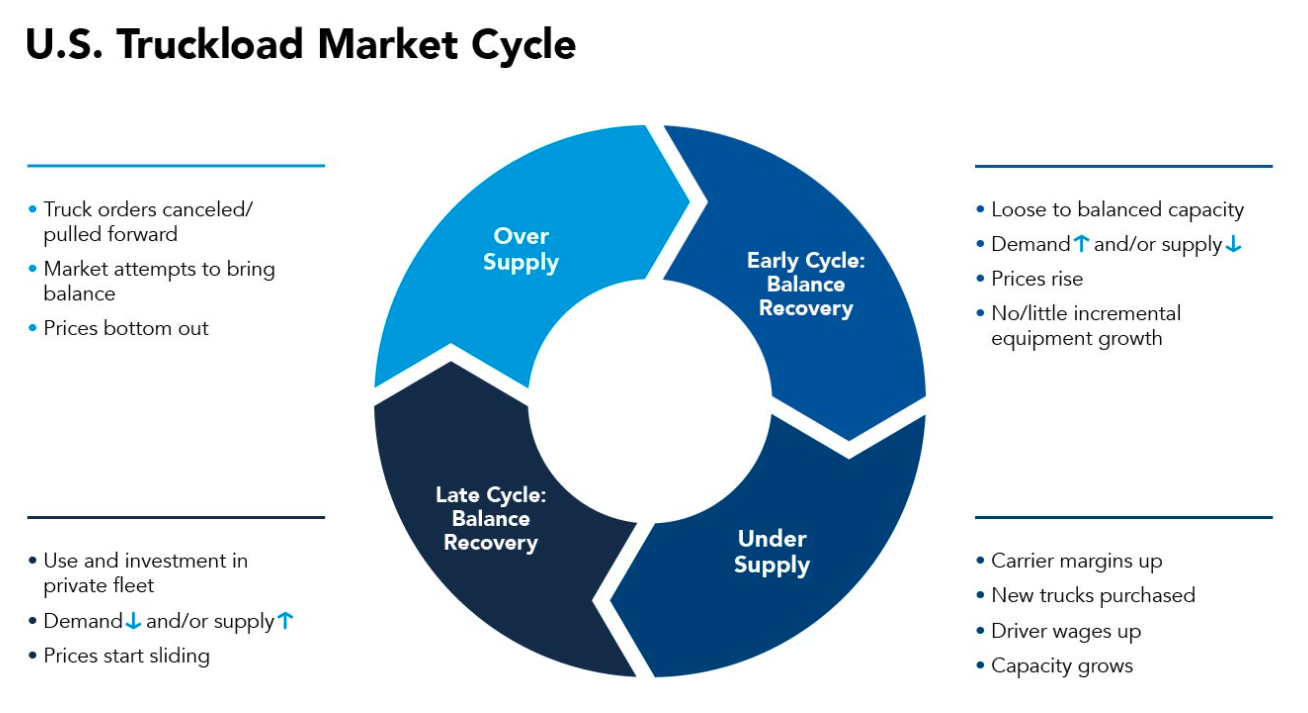
The U.S. truckload sector follows a recurring pattern over time, and our colleagues at C.H. Robinson have done an excellent job of visualizing this process with a clear graphic based on our breakdown of the truckload cycle.
Understanding the truckload cycle is essential for making informed decisions in the freight industry. By combining this knowledge with ACT's Class 8 tractor data, you can better predict where we are in the cycle and prepare accordingly for what comes next.
**Early Cycle: Demand Recovery and Tightening Supply**
The cycle often begins in a relaxed or balanced market, where growing freight demand starts to put pressure on capacity. As more shippers look for trucks, capacity tightens, leading to driver shortages. This shift gives carriers more pricing power, starting with the spot market and eventually influencing contract rates about six months later. During this phase, Class 8 tractor production tends to be low, while spot load-to-truck ratios and rates rise, along with increasing orders for new equipment.
**Mid-Cycle: Fleet Expansion and Capacity Growth**
As rates climb and margins improve, fleets are able to attract more drivers by offering better pay. With improved profitability, many operators invest in new trucks and trailers, pushing up production levels. Due to the highly fragmented nature of the industry, thousands of fleets often make similar expansion decisions around the same time, which can lead to overcapacity. This stage is marked by high Class 8 tractor build rates and long order backlogs.
**Mid-Late Cycle: Shippers Take Action**
Meanwhile, shippers begin to look for ways to cut costs by improving efficiency and shifting freight to their private fleets. At the same time, the cycle has been running for a while, and for-hire freight growth may slow or even reverse. This creates a mismatch between rising capacity and slowing demand, which drives down truckload rates. Carriers face declining profits, leading to fewer orders and increased cancellations.
**Late Cycle: Adjustments and Slowdown**
As the cycle matures, the pressure from driver shortages eases, though it never fully disappears. Operators respond by cutting back on equipment spending and canceling orders. This leads to a slowdown in new truck acquisitions, gradually bringing supply and demand back into balance. Eventually, freight demand picks up again, restarting the cycle.
By recognizing where we are in the cycle, businesses can better plan their strategies, manage costs, and stay ahead of market changes.